
Entities belonging to two classes, say class 0 and class 1, are described in terms of a number of attributes (columns). The task is to learn certain rules and to use them to construct a predictive model, capable to accurately classify entities in terms of the values of their observed attributes.
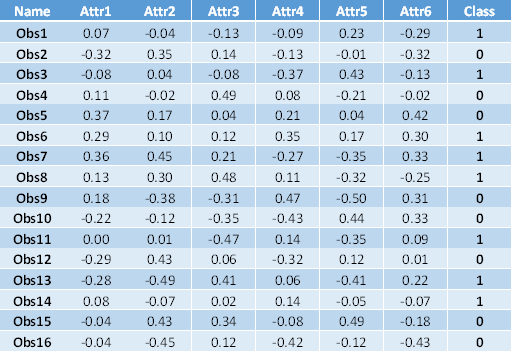
As an example, the next table contains 16 observations (Obs 1-Obs 16), described in terms of attributes (Attr 1-Attr 6), and their classification is shown in the last column (Class).
Download the application from the repository.
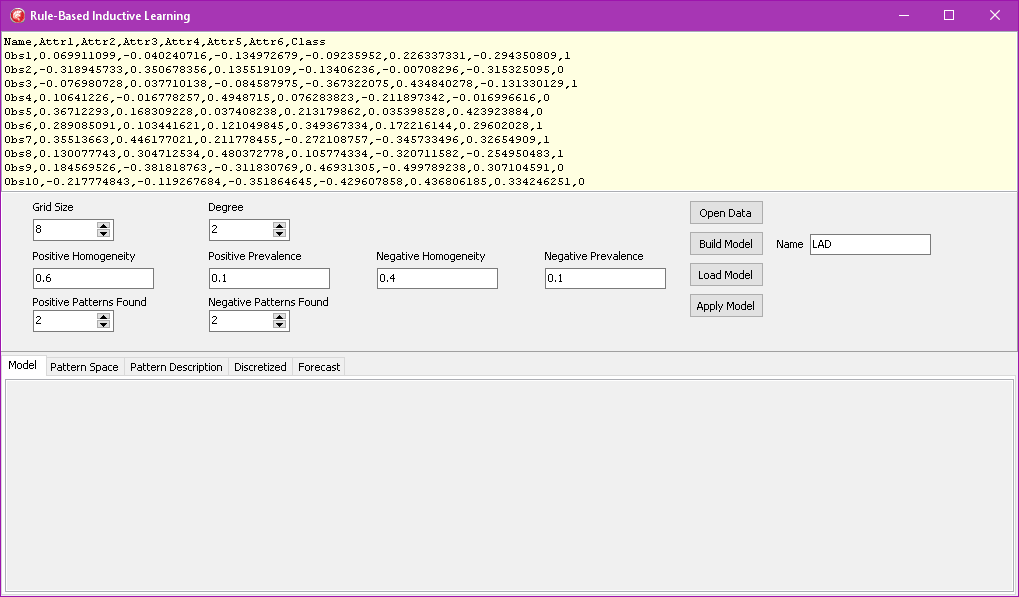
The demo data that is preloaded can be used for this exercise, but you can use Open Data button to load any text file, comma separated, having the following structure:
– the first line contains the header: “Name”, list of the attribute names, and finally the “Class”
– each of the remaining lines contains information about one observation (item): the item Id, followed by real numbers describing the item’ attributes; the last entry is the item class, 0 or 1.
Here is an example containing the first three lines of the input file from the previous example.
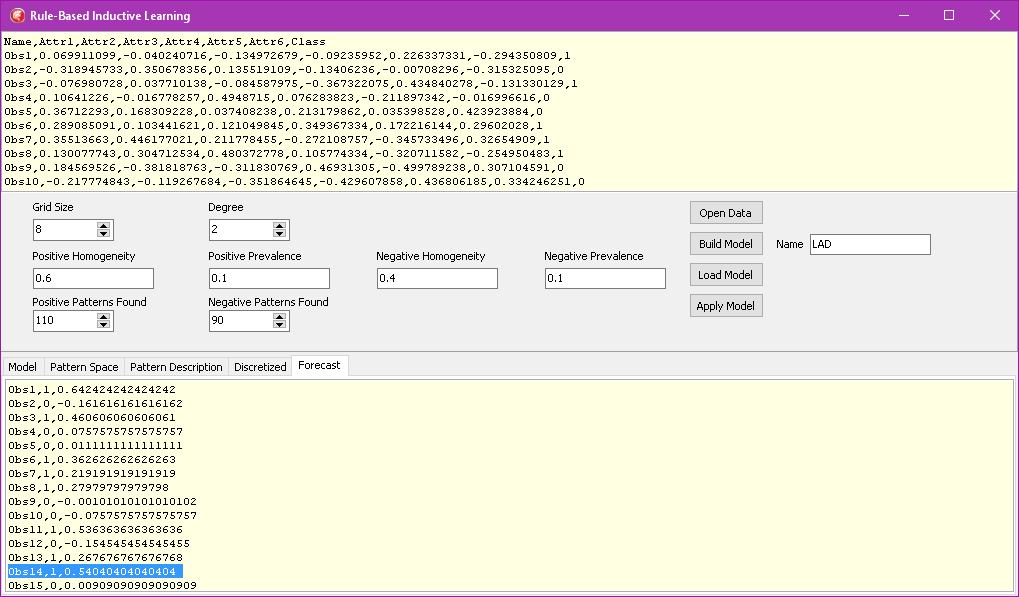
Name,Attr1,Attr2,Attr3,Attr4,Attr5,Attr6,Class
Obs1,0.069911099,-0.040240716,-0.134972679,-0.09235952,0.226337331,-0.294350809,1
Obs2,-0.318945733,0.350678356,0.135519109,-0.13406236,-0.00708296,-0.315325095,0
After you press the Build Model button, you shall see lower tabs containing the following results:
- Model description (*.MOD)- contains all information needed to apply the model to new data
- Pattern Space (*.PAT)– an incidence matrix for patterns on columns, items on rows, annotating each pair of a pattern triggered by an item with 1
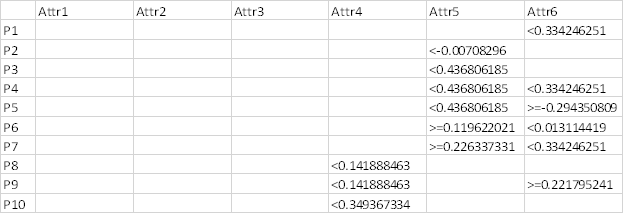
- Pattern Description (*.DES)– a conjunction imposed on the attributes with the bounding conditions “<“, “>=”. For example, P6,,,,,>=0.119622021,<0.013114419 encodes the following definition: Attr5 greater or equal than 0.119622021 and Attr6<0.013114419. To obtain a tabular view of this report, import it in Excel and use Data/Text to Columns menu, with comma as the separator.
4. Discretized space (*.GRD) – shows the codification of the attribute values as bucket indexes
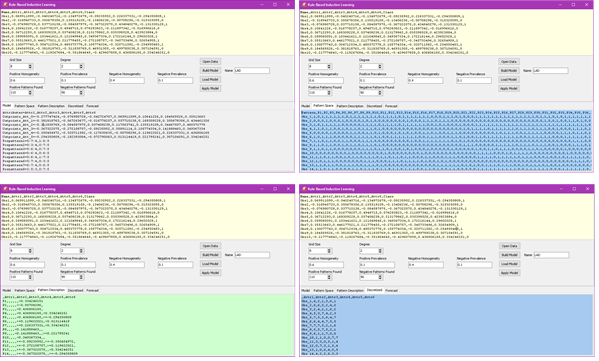
The final action is Apply Model. This action creates the forecasting report, each line showing the ID, the real class and the forecasting index. For instance, the line
Obs14,1,0.54040404040404
displays Item 14 which belong to class 1. The forecast is 0.54. Forecasting index ranges from -1 to 1.
A positive value implies that the item should be classified as belonging to class 1. A negative value of the index implies that the item should be classified as belonging to class 0. For this example, this classification model was correct 11 times out of the 16 items.
For additional information about this algorithm please read the paper
Accelerated Algorithm for Pattern Detection in Logical Analysis of Data Reference